Reliability dashboard
Data is based on customer flights with Skydio X10 between Apr 1st and June 31st 2026 unless otherwise noted.
Sept 22nd, 2026
Reliability Dashboard Update Summary
This dashboard provides transparency into real-world safety and reliability performance across customer operations. Data is updated quarterly with a one-quarter delay to allow investigations to complete and counts to stabilize.
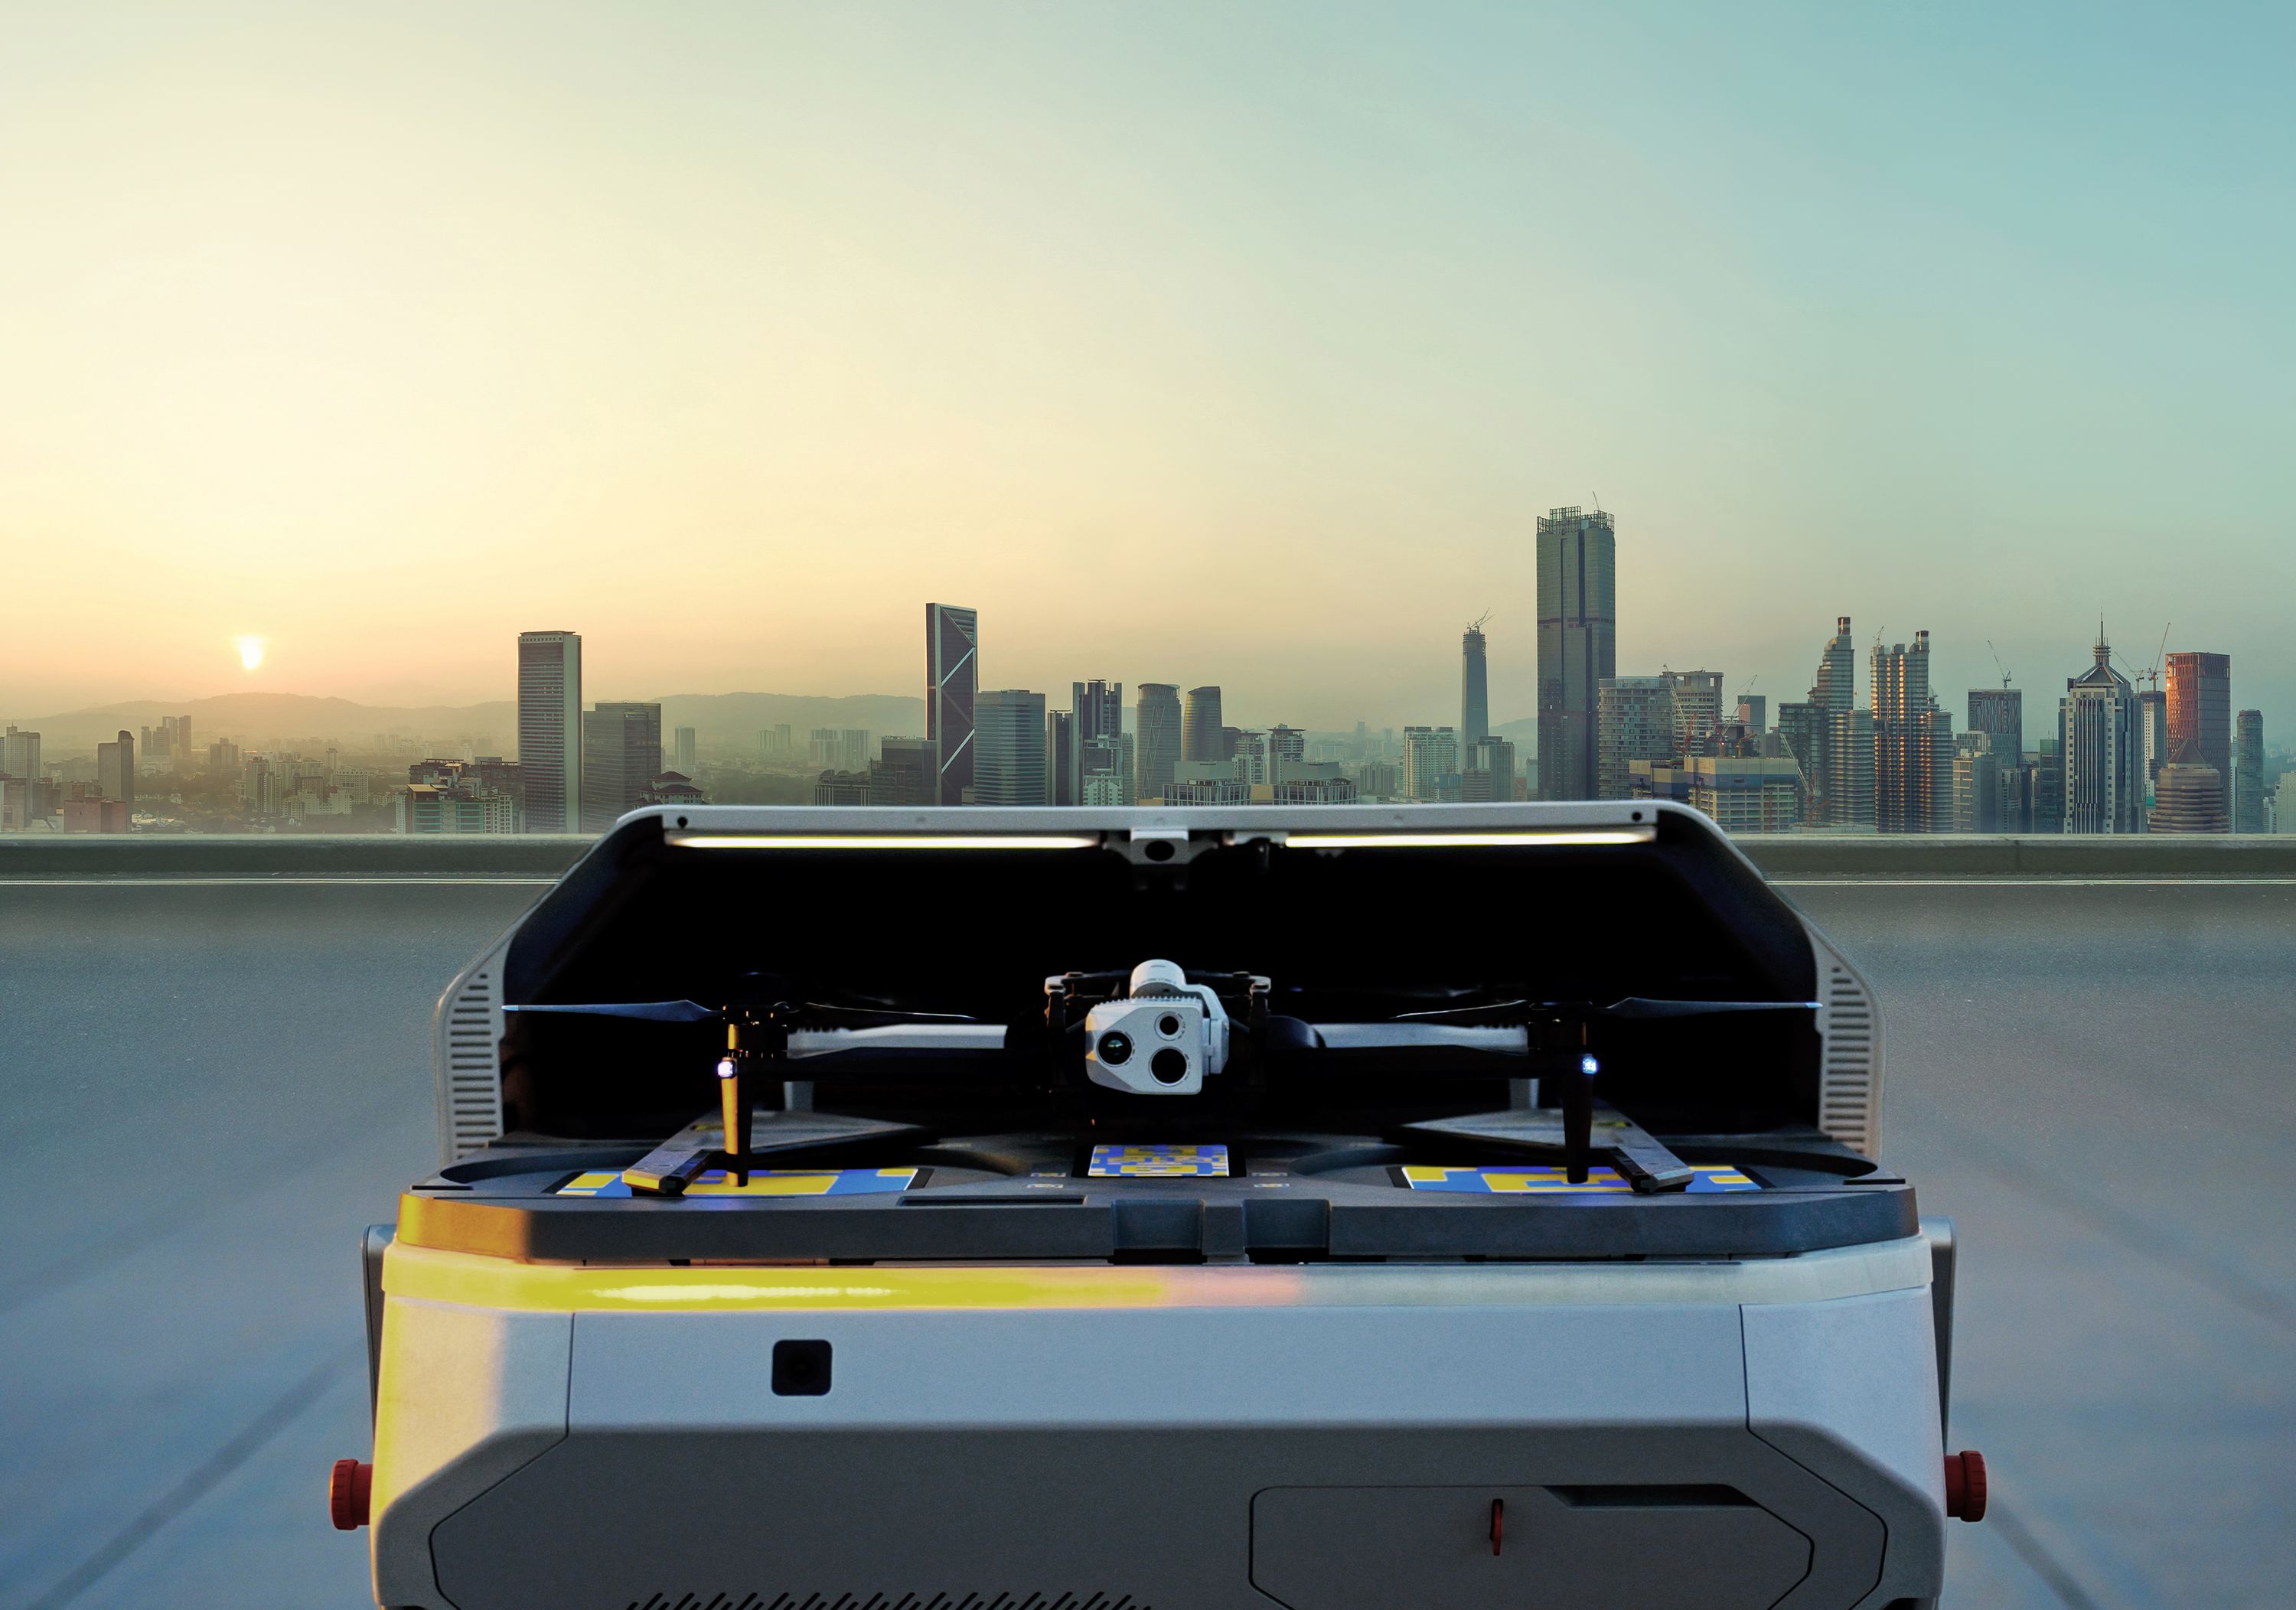
From April through June 2026, the reliability rate improved by more than 50% compared with the previous quarter and improved by over 150% year over year. Technical Malfunction and Human Factors reliability rates improved substantially. Environmental Factor incidents increased, driven primarily by a rise in bird strikes during the spring months. A key driver of the technical and human-factor improvements was the broad adoption of our Cayley software release which has demonstrated significant reliability improvements from prior releases. Improvements were also driven by rapid growth in dock-based flights, which comprised nearly 50% of total flight volume and doubled quarter over quarter. Dock-based flights have shown a 3x higher reliability rate than controller-based flights, with some use cases exceeding this by a healthy margin. Our data continues to show that dock-based operations are the safest way to fly at scale.
Reliability Rate Breakdown:
Technical Factors
The reliability rate due to Technical Malfunctions improved by more than 50% compared with the prior quarter. Obstacle Avoidance failures remained the most common category, while software-stability improvements in Cayley and a higher percentage of dock-based flights drove most of the gains. In Q1, Cayley accounted for roughly 30% of flight volume; in Q2, it exceeded 90%. Cayley also addressed several emergency-landing triggers and added IMU sensor redundancy, mitigating in-flight sensor failures.
Human Factors
The reliability rate due to Human Factors improved by more than 70%. As noted above, this is heavily driven by increased dock usage, which avoids many of the risk factors of controller-based flights, but we are also seeing the impacts of improved automatic NightSense behaviors and reduced power draw. Most incidents still fall into two buckets: crashes after the pilot turned off obstacle avoidance, and damage during takeoff or landing. The vast majority of these incidents could be avoided by adhering to our recommended 10 ft of clearance for takeoff and landings and keeping obstacle avoidance on during flight.
Environmental Factors
The reliability rate due to Environmental Factors dropped by nearly 50% from the previous quarter. However, with only 14 incidents across nearly 400,000 flights, this factor is highly sensitive to small changes in raw counts. We saw a sharp rise in bird strikes causing 10 incidents, plus two additional confirmed instances of gunshot/air-rifle damage, and damage from extreme winds well outside our specifications.
Dock Landing Reliability
Dock landing success reached 99.91% by the end of the period. As before: most landings outside the Dock are not crashes; they are landings at safe alternate sites or next to the Dock, so designating safe alternate landing zones remains important.
Reliability rate
(# of flights between incidents)
Incident rate by factor
Technical malfunctions
Environmental factors
Human factors
Total parachute recoveries
Reliability rate trend
Reliability rate by software release
Flights between incidents per release (lifetime)
Dock landing success
Reliability is the most important feature.
We believe transparency is a foundational element of safety and reliability. Every time an aviation asset takes to the air, there is some level of risk, whether it’s a commercial jetliner, a crewed helicopter, or a drone. This dashboard is intended to give our customers a data-driven view of the reliability of the systems they are operating so they can exercise their best judgment on how, where, and why to fly.*
These metrics are also part of how we hold ourselves accountable for continual progress. Every Skydio mission with an online drone** contributes to this dashboard. With millions of customer flights in challenging environments, we have the scale and data maturity to detect rare events, validate performance, and continuously improve reliability.
*Always follow Skydio’s safety and operating instructions when you fly. These figures do not predict the outcome of any individual flight, create guarantees or warranties (express or implied), or change the terms of your agreement with Skydio.
**Flights conducted on X10D and X2D systems do not transmit logs or other telemetry and as a result are not represented in the above dashboard.